The power of groupby and aggregation
Contents
4. The power of groupby and aggregation#
So far, pandas probably seems like a more user friendly NumPy. However, it allows much greater flexibility that NumPy does not.
A common operation in psychology is to examine how some measure varies between or across groups. For example, if we measure depression and want to see how it differs between men and women, we will need to average depression scores separately for men and women. You’re experienced enough to know many psychology experiments have many more complex designs - one score under different levels of different variables.
How could you calculate those means and standard deviations in your raw data? You could use very complex subsettings for this in an array. But Pandas has a method which is the forefront of the split-apply-combine approach.
This can be confusing, but very powerful - its worth learning in detail.
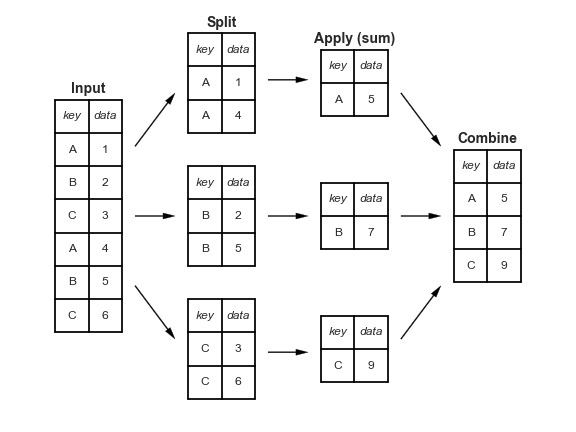
The split-apply-combine approach works by taking a set of data, and subsetting it (i.e., split) into sub-groups where the grouping variable of choice is constant.
Then, the desired function is applied - this could be the mean, standard deviation, or some other more complex function.
Finally, the newly calculated data is combined back into a DataFrame that looks similar in appearance to the original.
Sounds like a lot of work - but pandas makes this easy using the .groupby() method.
.groupby() is called on a DataFrame, and takes a keyword, by. This tells the DataFrame to split by the unique values in this variable. Its worth noting Pandas won’t return anything at this point - just that it has rearranged your data in an efficient way and is ready to apply some functions.
A simple example - compute the mean values of all variables in the mtcars dataset, differing between automatic or manual cars - stored in the am variable (has 0 or 1).
# Demonstrate groupby
grouped = mtcars.groupby(by='am')

# Look
print(grouped)
<pandas.core.groupby.generic.DataFrameGroupBy object at 0x128badfc0>
You get a special ‘object’ that indicates your data is successfully split, but has all the usual methods of a DataFrame that you can use to interact with.
# Now apply a function - mean
means = grouped.mean()

display(means)

# One line
one_liner = mtcars.groupby(by='am').mean()
display(one_liner)
| mpg | cyl | disp | hp | drat | wt | qsec | vs | gear | carb | |
|---|---|---|---|---|---|---|---|---|---|---|
| am | ||||||||||
| 0 | 17.147368 | 6.947368 | 290.378947 | 160.263158 | 3.286316 | 3.768895 | 18.183158 | 0.368421 | 3.210526 | 2.736842 |
| 1 | 24.392308 | 5.076923 | 143.530769 | 126.846154 | 4.050000 | 2.411000 | 17.360000 | 0.538462 | 4.384615 | 2.923077 |
Adding complexity to this is very simple. If you want to split by more variables, pass them as a list to groupby().
# Group by transmission (am) and by number of gears (gear)
trans_gear = mtcars.groupby(by=['am', 'gear']).mean()
display(trans_gear)
| mpg | cyl | disp | hp | drat | wt | qsec | vs | carb | ||
|---|---|---|---|---|---|---|---|---|---|---|
| am | gear | |||||||||
| 0 | 3 | 16.106667 | 7.466667 | 326.3000 | 176.133333 | 3.132667 | 3.8926 | 17.692 | 0.20 | 2.666667 |
| 4 | 21.050000 | 5.000000 | 155.6750 | 100.750000 | 3.862500 | 3.3050 | 20.025 | 1.00 | 3.000000 | |
| 1 | 4 | 26.275000 | 4.500000 | 106.6875 | 83.875000 | 4.133750 | 2.2725 | 18.435 | 0.75 | 2.000000 |
| 5 | 21.380000 | 6.000000 | 202.4800 | 195.600000 | 3.916000 | 2.6326 | 15.640 | 0.20 | 4.400000 |
This is an easy way to group your data. But sometimes you don’t want all of your variables out of a groupby object. In that case, simply index the groupby object before applying the function!
# Get mean miles per gallon from am and gear
mean_mpg = mtcars.groupby(by=['am', 'gear'])[['mpg']].mean()
display(mean_mpg)
| mpg | ||
|---|---|---|
| am | gear | |
| 0 | 3 | 16.106667 |
| 4 | 21.050000 | |
| 1 | 4 | 26.275000 |
| 5 | 21.380000 |
4.1. .reset_index() - a note#
You might notice that the index of the DataFrames look a little unusual - there appears to be a kind of ‘nested’ structure to them. This is intentional on Python’s part - it allows you to store multidimensional (more than 2) data in the essentially 2D data structure of the DataFrame. This is known as a MultiIndex, which we won’t use much in this course.
You can easily remove it back to a standard representation by using the .reset_index() method.
# Reset
display(mean_mpg.reset_index())
| am | gear | mpg | |
|---|---|---|---|
| 0 | 0 | 3 | 16.106667 |
| 1 | 0 | 4 | 21.050000 |
| 2 | 1 | 4 | 26.275000 |
| 3 | 1 | 5 | 21.380000 |
4.2. Other pandas data manipulation tools - .transform()#
There are two more tools to know about for manipulating data with Pandas.
The first is .transform(). This allows you to apply a function of your choice to a DataFrame, but with the restriction that the output will be forced to be the same size as the original DataFrame. This is helpful when you want to have a value repeated, rather, as you have seen, collapsing the data down into a smaller or different sized DataFrame. An example will help:
# Subset mt cars with just a few variables
sub = mtcars[['model', 'gear', 'hp']].copy()
display(sub.head())
| model | gear | hp | |
|---|---|---|---|
| 0 | Mazda RX4 | 4 | 110 |
| 1 | Mazda RX4 Wag | 4 | 110 |
| 2 | Datsun 710 | 4 | 93 |
| 3 | Hornet 4 Drive | 3 | 110 |
| 4 | Hornet Sportabout | 3 | 175 |
# Group by the number of gears, then 'transform' by computing the mean of HP - add this back to the original DF!
sub['Subgroup_Mean_HP'] = sub.groupby('gear').transform('mean')
display(sub.head(), sub.tail())
/var/folders/mw/xt4ddf0j2n3dr4qcr__qhqlr0000gn/T/ipykernel_2968/2279592361.py:2: FutureWarning: Dropping invalid columns in DataFrameGroupBy.transform is deprecated. In a future version, a TypeError will be raised. Before calling .transform, select only columns which should be valid for the function.
  sub['Subgroup_Mean_HP'] = sub.groupby('gear').transform('mean')
| model | gear | hp | Subgroup_Mean_HP | |
|---|---|---|---|---|
| 0 | Mazda RX4 | 4 | 110 | 89.500000 |
| 1 | Mazda RX4 Wag | 4 | 110 | 89.500000 |
| 2 | Datsun 710 | 4 | 93 | 89.500000 |
| 3 | Hornet 4 Drive | 3 | 110 | 176.133333 |
| 4 | Hornet Sportabout | 3 | 175 | 176.133333 |
| model | gear | hp | Subgroup_Mean_HP | |
|---|---|---|---|---|
| 27 | Lotus Europa | 5 | 113 | 195.6 |
| 28 | Ford Pantera L | 5 | 264 | 195.6 |
| 29 | Ferrari Dino | 5 | 175 | 195.6 |
| 30 | Maserati Bora | 5 | 335 | 195.6 |
| 31 | Volvo 142E | 4 | 109 | 89.5 |
4.3. Other pandas data manipulation tools - .agg()#
On the other hand, .agg() is designed to give you access to a range of ‘aggregation’ functions. It is in a sense the opposite of .transform(), because .agg() will collapse the DataFrame down into aggregated versions, but offers a wide range of flexibility, including asking for multiple functions, and applying across either rows or columns.
# Grab multiple summary statistics from DataFrame
display(mtcars.agg(['mean', 'std', 'var', 'sum']))
/var/folders/mw/xt4ddf0j2n3dr4qcr__qhqlr0000gn/T/ipykernel_2968/3822526560.py:2: FutureWarning: ['model'] did not aggregate successfully. If any error is raised this will raise in a future version of pandas. Drop these columns/ops to avoid this warning.
  display(mtcars.agg(['mean', 'std', 'var', 'sum']))
| model | mpg | cyl | disp | hp | drat | wt | qsec | vs | am | gear | carb | |
|---|---|---|---|---|---|---|---|---|---|---|---|---|
| mean | NaN | 20.090625 | 6.187500 | 230.721875 | 146.687500 | 3.596563 | 3.217250 | 17.848750 | 0.437500 | 0.406250 | 3.687500 | 2.812500 |
| std | NaN | 6.026948 | 1.785922 | 123.938694 | 68.562868 | 0.534679 | 0.978457 | 1.786943 | 0.504016 | 0.498991 | 0.737804 | 1.615200 |
| var | NaN | 36.324103 | 3.189516 | 15360.799829 | 4700.866935 | 0.285881 | 0.957379 | 3.193166 | 0.254032 | 0.248992 | 0.544355 | 2.608871 |
| sum | Mazda RX4Mazda RX4 WagDatsun 710Hornet 4 Drive... | 642.900000 | 198.000000 | 7383.100000 | 4694.000000 | 115.090000 | 102.952000 | 571.160000 | 14.000000 | 13.000000 | 118.000000 | 90.000000 |
Notice how pandas warns us that for some columns, things are going wrong. For example, pandas cannot compute the mean of the model column - what does it mean to average of a bunch of strings? However, notice it can sum the model names together, because Python can ‘add’ strings together. It warns us we should drop these columns before we do anything, so let us do so, and follow it with a group-by.
# Combine with drop/groupby chained operation
grouped_data = mtcars.drop(columns='model').groupby(['am', 'gear'])
display(grouped_data.agg(['mean', 'std']))

# Works the same in a single line of course
display(mtcars.drop(columns='model').groupby(by=['am', 'gear']).agg(['mean', 'std']))
| mpg | cyl | disp | hp | drat | wt | qsec | vs | carb | |||||||||||
|---|---|---|---|---|---|---|---|---|---|---|---|---|---|---|---|---|---|---|---|
| mean | std | mean | std | mean | std | mean | std | mean | std | mean | std | mean | std | mean | std | mean | std | ||
| am | gear | ||||||||||||||||||
| 0 | 3 | 16.106667 | 3.371618 | 7.466667 | 1.187234 | 326.3000 | 94.852735 | 176.133333 | 47.689272 | 3.132667 | 0.273665 | 3.8926 | 0.832993 | 17.692 | 1.349916 | 0.20 | 0.414039 | 2.666667 | 1.175139 |
| 4 | 21.050000 | 3.069745 | 5.000000 | 1.154701 | 155.6750 | 13.978883 | 100.750000 | 29.010056 | 3.862500 | 0.115000 | 3.3050 | 0.156738 | 20.025 | 2.041854 | 1.00 | 0.000000 | 3.000000 | 1.154701 | |
| 1 | 4 | 26.275000 | 5.414465 | 4.500000 | 0.925820 | 106.6875 | 37.162978 | 83.875000 | 24.174588 | 4.133750 | 0.345912 | 2.2725 | 0.460814 | 18.435 | 1.158916 | 0.75 | 0.462910 | 2.000000 | 1.309307 |
| 5 | 21.380000 | 6.658979 | 6.000000 | 2.000000 | 202.4800 | 115.490636 | 195.600000 | 102.833847 | 3.916000 | 0.389525 | 2.6326 | 0.818925 | 15.640 | 1.130487 | 0.20 | 0.447214 | 4.400000 | 2.607681 | |
# Even cooler, pass specific functions to specific columns using a dictionary, omitting the need to drop nuisance columns
various = grouped_data.agg({'mpg':['mean', 'std'], 'hp':'sum', 'cyl':['var', 'median']})
display(various)
| mpg | hp | cyl | ||||
|---|---|---|---|---|---|---|
| mean | std | sum | var | median | ||
| am | gear | |||||
| 0 | 3 | 16.106667 | 3.371618 | 2642 | 1.409524 | 8.0 |
| 4 | 21.050000 | 3.069745 | 403 | 1.333333 | 5.0 | |
| 1 | 4 | 26.275000 | 5.414465 | 671 | 0.857143 | 4.0 |
| 5 | 21.380000 | 6.658979 | 978 | 4.000000 | 6.0 | |
Sometimes, you don’t want the grouping variables to be in the index. If so, you can pass as_index=False in the call to groupby. In addition, the agg function supports a named-tuple assignment that allows you to change the names of the resulting aggregation outputs. Lets see what that looks like:
# Demonstrate as_index=False and named tuple assignment
cool = mtcars.groupby(['am', 'gear'], as_index=False).agg(average_mpg_right_here=('mpg', 'mean'))
display(cool)
| am | gear | average_mpg_right_here | |
|---|---|---|---|
| 0 | 0 | 3 | 16.106667 |
| 1 | 0 | 4 | 21.050000 |
| 2 | 1 | 4 | 26.275000 |
| 3 | 1 | 5 | 21.380000 |